
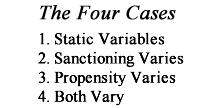
The Four Cases
Identifying the Four Cases
In order to study both criminal propensity and sanctioning, it is important to determine what is varying. If the standard deviation of the normal distribution is set to one, then there are four possible cases that represent possible types of variation in the mean and threshold level. The first case is no variation in mean propensity or the sanctioning threshold. This happens most of the time in a single community, where crime rates remain fairly constant over time. The second case occurs when there is variation in the sanctioning threshold, but criminal propensity is constant. This occurs when there is a change in the legal system which affects the apparent crime rate. The third case occurs when there is variation in the mean level of criminal propensity, but not in the sanctioning threshold. The third case occurs in the age crime curve. Finally, the last case is where criminal propensity and the sanctioning threshold are both changing. This is often the case in comparative criminology, where the criminologist is interested in differences in crime rates between communities. In this case, it is hard to determine the relative effects of propensity and sanctioning on the crime rates. These four cases are important for the analysis of the relationship between criminal propensity, sanctioning, and crime rates.
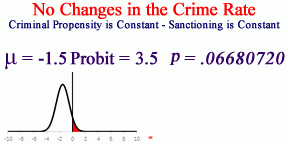
Case Number 1: No Variation in Criminal Propensity or Sanctioning
If there is no variation in the mean criminal propensity and the sanctioning level remains constant, the crime rate tends to remain relatively stable over time. There may be random variation, but there is no long term movement in the average rate of crime. This phenomenon was noted by Quetelet (1835), who discussed a “crime budget” with a relatively constant number of murders, thefts, etc.
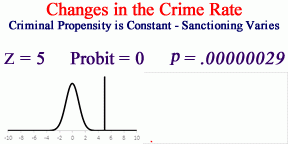
Case Number 2: Criminal Propensity is Constant, and Sanctioning Varies
If the mean level of criminal propensity is constant and the sanctioning level varies, the crime rate tends to follow a sigmoid curve with changes in sanctioning level. This is what occurs with the increases in sanctioning that occurred in the past few years in the United States. This process highlights the problem with trying to sanction crimes. The number of people sanctioned increases nonlinearly and sanctioning levels increase.
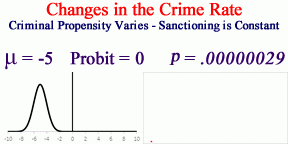
Case Number 3: Variation in the Mean Criminal Propensity with Constant Sanctioning
If there is variation in the mean criminal propensity and the sanctioning level remains constant, the crime rate tends to follow a sigmoid curve with changes in the mean propensity level. This is what occurs in the age crime curve. As mean propensity changes with age, the crime rate follows a sigmoid curve.
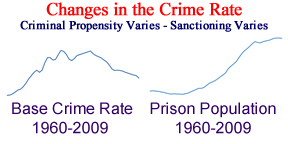
Case Number 4: Criminal Propensity Varies and Sanctioning Varies
If both criminal propensity and sanctioning are varying, as happened in the US from 1960-2009, it is difficult to determine what will happen to the crime rate. Researchers will need to try to determine how much of the variation in the crime rate is due to each of the contributing factors.
Try it yourself
I created an Excel spreadsheet so you can play around with the four cases. Right click on the link below and click “Save As” to save this file to a location on your computer. The spreadsheet is macro enabled so that you can print the charts if you want.