The Development of Criminal Propensity
The Development of Criminal Propensity
One of the first important findings to come out of the initial aggregation of crime statistics in France in the early 1800s was the understanding that criminal propensity varies by age (Quetelet, 1833; 1984). Quetelet suggested that human development caused the observed variation in the crime rate by age. Criminologists have not been able to demonstrate how human development acts to affect the crime rate over the life course. The missing piece from the criminological puzzle was the sigmoid nature of the relationship between propensity, sanctioning, and crime. If crime rates are sigmoid, one must use an inverse probit model to convert the age crime curve to an age propensity curve, and then figure out how the age propensity curve is created by human development. It will be demonstrated that a maturity gap of about 5 years between the development of strength and mental capacities will result in an age propensity curve that fits the age crime curve.
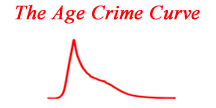
The Age Crime Curve
One of the enduring puzzles in criminology is the age crime curve puzzle. Why do crime rates rise from almost zero in early childhood to a peak in late adolescence, and then fall to almost zero in late adulthood? This phenomenon was noted by Quetelet (1833; 1984), and he suggested that the pattern seen in crime rates over the life course was due to developmental changes in the human organism. This explanation does not seem to have been adequately explored.
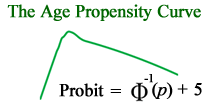
The Age Propensity Curve
The first step in solving the age crime curve puzzle is to recognize that crime rates have a nonlinear sigmoid relationship with criminal propensity and sanctioning. In order to determine how criminal propensity is changing over the life course, one needs to find the value of the propensity and sanctioning levels that would create a particular crime rate. If one assumes that sanctioning operates the same for people at all ages, it is possible to solve for the propensity level. The method that is easiest to use for calculating the propensity level is called the method of probits. A probit value for criminal propensity is obtained by calculating the inverse of the crime rate and adding five to the result. If one applies the method of probits to the age crime curve, the result is the age propensity curve on the left.
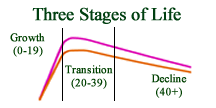
The Three Stages of Life
One of the problems with studying crime over the life course is that the various underlying processes are operating differently at different ages. A method for simplifying the study of the life course is to split up the analysis into stages of the life course. There appear to be three stages of development with somewhat uniform processes occurring in each stage. The period from about 0-19 is characterized by relatively stable growth. Both the physical and mental capabilities are growing during this period. The period from 20-39 is characterized by a transition from growth to decline in both physical and mental capabilities. In the period from about 40 onwards, both physical strength and mental capacities are in a period of steady decline.
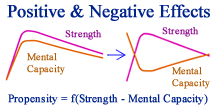
Both Positive and Negative Effects
Another important piece of the age crime curve puzzle is recognizing that development has both positive and negative effects on criminal propensity. As strength develops over the life course, it provides a positive effect on criminal propensity by creating an increased capacity for crime. As mental capacity develops, it creates a negative effect on criminal propensity by providing an increased capacity to avoid criminal behavior. The net effect of physical and mental development on criminal propensity can be expressed by a function of strength minus mental capacity. Visually, one must flip the mental capacity curve upside down in order to show its negative effect on criminal propensity.
The Maturity Gap
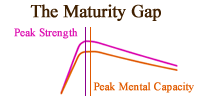
One of the pieces of the age crime curve puzzle is a five year maturity gap between the development of peak physical strength and the development of peak mental capacity. People develop peak strength in their bodies before their brains become ready to handle that strength. The net effect is a period during late adolescence where crime rates crime rapidly as physical development outpaces mental development, and then a period in young adulthood where crime rates drop almost as rapidly as brain development catches up with physical development.

Assembling the Pieces
Once the pieces are identified, all that remains is to put them together. Strength and mental capacity have both positive and negative effects on criminal propensity. Because of a maturity gap, these two developmental processes combine to create an age propensity curve. Crime rates have a sigmoid relationship with criminal propensity, and so a nonlinear transformation is needed to convert the criminal propensity curve to the age crime curve. The net result is that the age crime curve is a natural result of human development over the life course.
